
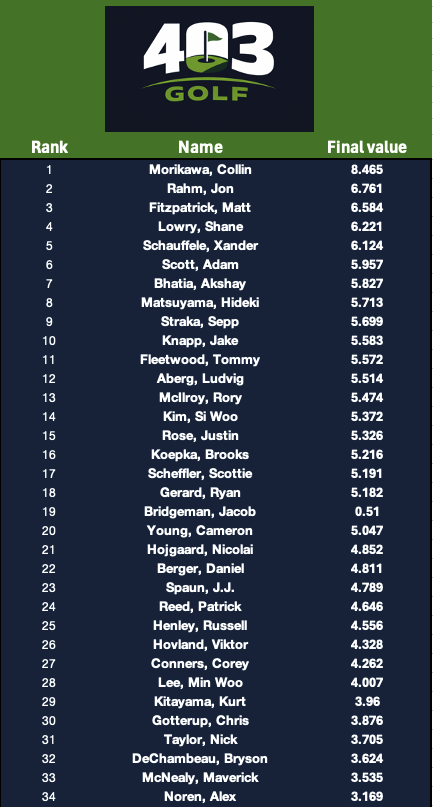
Below see the top 35 in the model for this weeks tournament: The Masters.
Be cautious about Collin Morikawa as he continues to deal with back issues, that was not factored into the model. Read below the model for further insight.
About the Model
The model is built using data pulled from DataGolf and the PGA Tour website. For each tournament, I analyze past editions to determine which statistical categories have historically played the most significant role in success at that specific venue.
From there, I compile each player’s Strokes Gained data across the selected categories and assign a numerical weight to each one based on its projected importance. An expected value calculation is then applied to generate the final rankings.
For this model the data I pulled from Data Golf is strictly using only the last 6 months.
For this tournament, the key statistical categories I’m using are:
- Strokes Gained: Approach
- Par 5 Scoring Average (Key to find birdies on the 5’s at Augusta)
- Strokes Gained: OTT
- Strokes Gained: ARG
- Strokes Gained: Putting
The numerical weights assigned to each category (in the order listed above) are:
0.55, 0.15, 0.1, 0.1, 0.1
A weighted expected value calculation is then performed to produce the final model output and rankings.