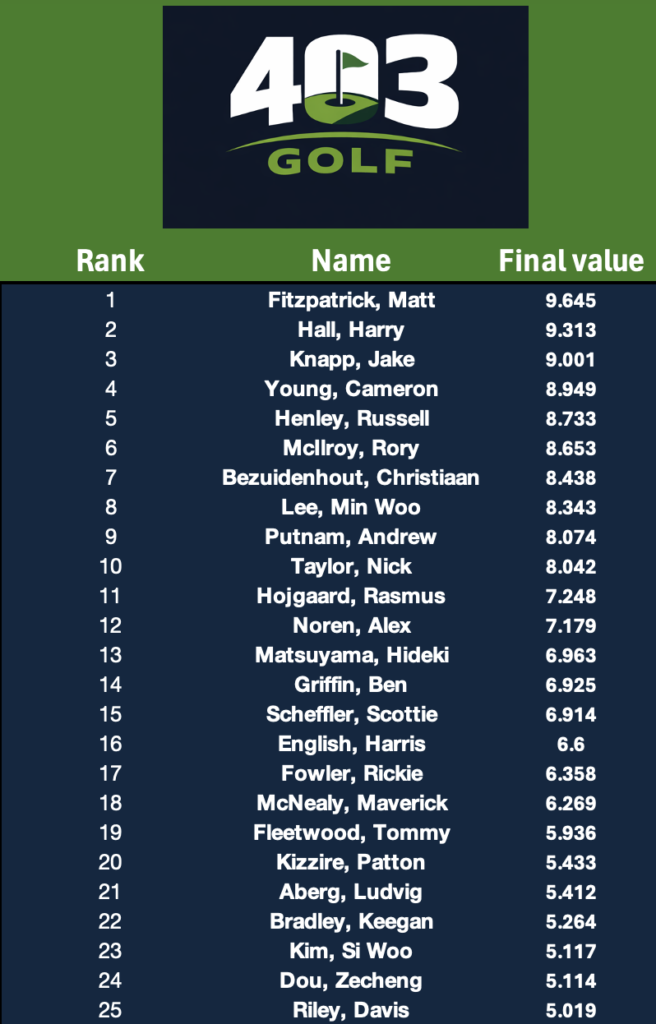
Below see the top 25 in our model for this week’s tournament
About The Model
My model is built using data pulled from DataGolf and the PGA Tour website. For each tournament, I analyze past editions to determine which statistical categories have historically played the most significant role in success at that specific venue.
From there, I compile each player’s Strokes Gained data across the selected categories and assign a numerical weight to each one based on its projected importance. An expected value calculation is then applied to generate the final rankings.
I changed it up for this tournament and am specifically using data only from January 2026 to now so it’s rewarding players in great form to start the year so definitely a strong recency bias.
For this tournament, the key statistical categories I’m using are:
- Strokes Gained: Approach (100-150 yards)
- Strokes Gained: Approach (200+ yards)
- Par 5 Scoring Average
- Strokes Gained: Driving accuracy
- Strokes Gained: Around the Greens
- Strokes Gained: Putting
The numerical weights assigned to each category (in the order listed above) are:
0.32, 0.25, 0.1, 0.22, 0.06, 0.05
A weighted expected value calculation is then performed to produce the final model output and rankings.